
Context
Project
Philadelphia health disparities aren’t connected to political geography, leaving council members without district-level insights for policy decisions.
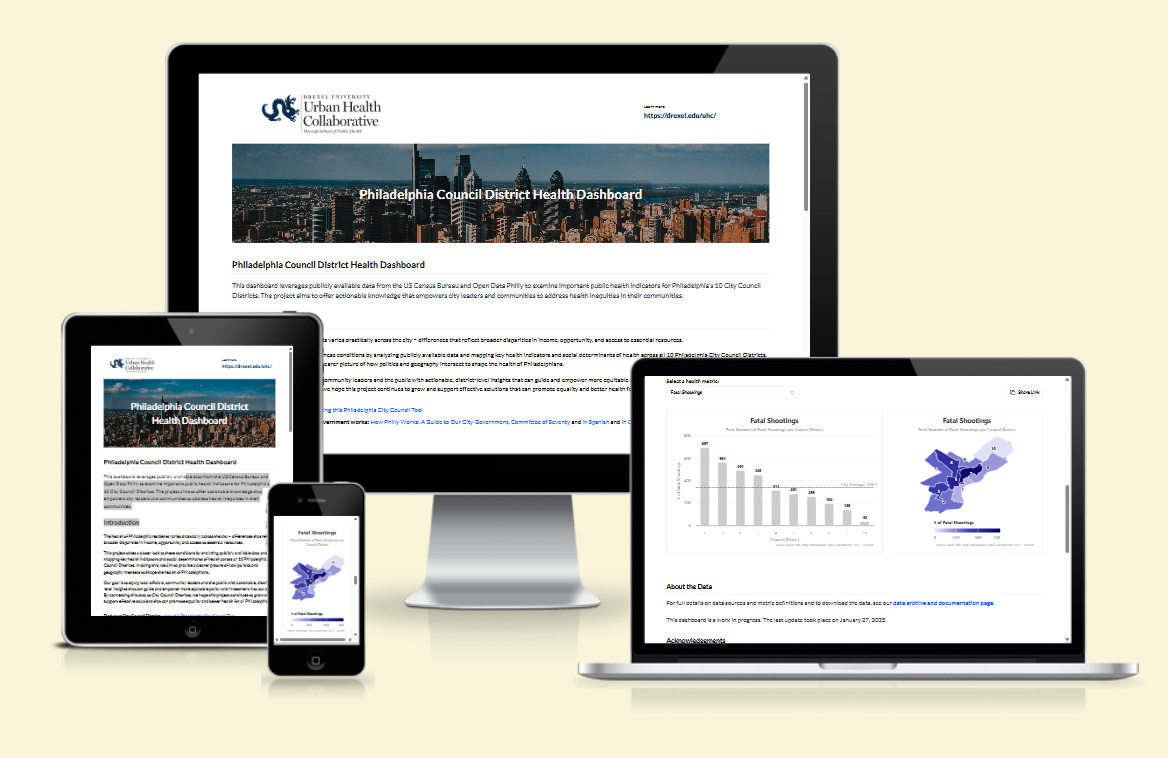
This deliverable is an interactive dashboard visualizing health determinants across 10 council districts, making public health data actionable for policy makers and citizens.
Team Structure
Data Engineer (Others)
- Developed Data Bundle
- Created static visualizations
- Provided text and mockup
- Tech stack design for operational limits:
- 3-month timeline
- 5 hours/week capacity
- zero infrastructure costs
- Developed prototype (R Shiny)
- Developed production application (Next.js)
- Deployed production application (GitHub Pages)
- Deployed data preservation (Zenodo)
Phases
Phase 1: Tech Stack Design (March 2025)
Operational Constraints:
- Zero budget for infrastructure costs
- 3-month delivery timeline
- 5 hours/week development capacity
- No ongoing maintenance resources
Architecture Decisions:
- Data Preservation: Zenodo integration for DOI/citation (free, permanent hosting)
- Prototyping: R Shiny to reuse Data Engineers’ code but make it dynamic
- Production Requirements: No cold starts needed → serverless SSG with modern UI
- Frontend: Next.js SSG for zero-cost hosting and instant loading
- Deployment: GitHub Pages static site (free, reliable)
- Analytics: Google Analytics for usage tracking (free)
- Performance: Client-side rendering for serverless architecture
- Data Pipeline: Custom R-to-web transformation (leverages existing analysis)
- SEO: Search optimization for discoverability
Phase 2: R Shiny Prototype (March-April 2025)
Rapid prototype for concept validation:
- Core interactions: dropdown selection, synchronized visualizations
- District highlighting and hover effects
- Stakeholder feedback integration
Phase 3: Next.js Production (May-June 2025)
Production rebuild optimized for budget and operational constraints:
Frontend Architecture:
- Next.js/React.js with Highcharts.js
- Static site generation for cost-effective hosting
Key Features:
- Synchronized bar charts and choropleth maps
- Custom Heat Vulnerability Index visualization
- Interactive district selection with highlighting
- Embedded documentation and metadata
Production Infrastructure:
- Embedded documentation and metadata
Technical Highlights
- Synchronized bar charts and choropleth maps
- Custom Heat Vulnerability Index visualization
- Interactive district selection with highlighting
Reflections
Things I really enjoyed
Lightweight tech stacks like these bring me great joy. You can leverage mature and developer-friendly open-science/open-source infrastructure such as GitHub Pages, Zenodo, and fully serverless application frameworks like SSG Next.js. This removes so much maintenance and operational work you have to do to maintain a deliverable and allows you to free up the time to focus on what is important: the UI of the final product and having a deep understanding of the stakeholders’ true needs.
Things to improve next time
- A quick turnaround like this meant we did a one-off type of architecture
- If this project continues, we will add interfaces for stakeholders to update data and modify metadata